Sales Report
The report contains information about all clicks, searches, purchases and clients brought in by the affiliate.
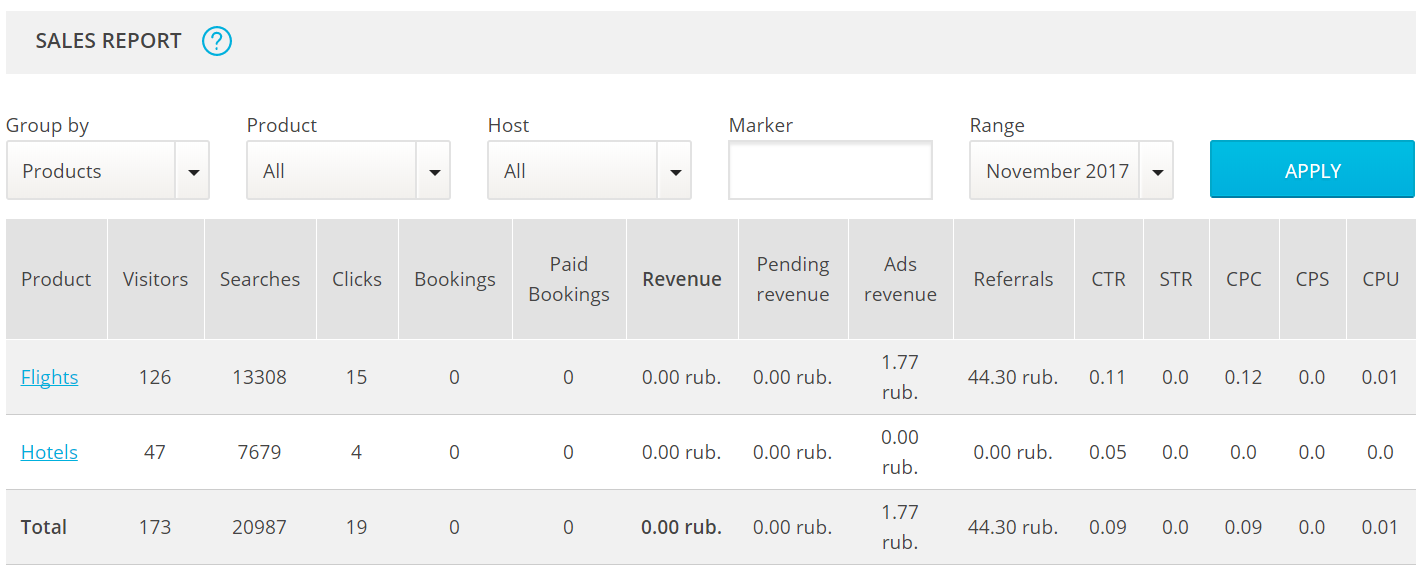
The table contains the following columns:
- Visitors – Number of unique people who have started searching for a flight/hotel on Jetradar or Hotellook.
- Searches – Number of searches initiated by visitors (i.e., how many times users entered a query and pressed "Search").
- Clicks – Number of clicks on the links in the search results.
- Bookings – Number of visitors who have booked tickets/hotel rooms.
- Paid Bookings – Number of paid bookings.
- Revenue – Income received by the affiliate from paid-for bookings.
- Pending Revenue – Total income from bookings that are currently being processed.
- Ads Revenue – rewards for clicks on advertising media on the sites of our projects Aviasales, Hotellook and Jetradar (the procedure of calculation and the amount of rewards are not disclosed). Statistics are updated once a day.
- Referrals – Income received by the affiliate from referrals.
- CTR – Click-through rate.
- STR – Sell-through rate (clicks vs. bookings).
- CPC – Cost per click (your income).
- CPS – Average cost per search (your income).
- CPU – Cost per user (your income)
Affiliates should pay close attention to the STR and CPU. These values allow for the assessing of the effectiveness of the tools and sources used to attract clients. The higher these numbers, the better the quality of the affiliate's traffic.
Good-quality traffic is targeted traffic, i.e., visitors who are using search not out of idle curiosity but to find and book tickets to a place of interest. This kind of traffic can be obtained from tourism-related sites and blogs.
Related Articles
Sales Report
Sales Report There is a simple way to track you sales and analyze the key indicators of your business. Go to AliDropship => Reports => Sales report. Set a time period that you want your sales report to be shown: First, you see Summary chart that ...Sales Report (Full Guide)
Sales Report (Full Guide) To see your 'Sales Report', from the store dashboard go to: > Reports > Sales Report From within this page you can track and analyse the key indicators of your business. The 'Overview' provides a summary of your total orders ...Activity Report (Full Guide)
Activity Report (Full Guide) To see your 'Activity Report', from the store dashboard go to: > Reports > Activity Report From within this page you can see all the changes you've made since the beginning.Traffic Report (Full Guide)
Traffic Report (Full Guide) To see your 'Traffic Report', from the store dashboard go to: > Reports > Traffic Report From within this page you can track, measure and analyze a great range of data, the first being the 'Overview Report': In this graph ...How to use Facebook Ads
Facebook Ads can take your drop shipping business to a brand new level – or, in some cases, cause damage. This will never happen if you go by our instructions and treat them right! When you start your dropshipping business, you come to a conclusion ...