Traffic Report (Full Guide)
To see your 'Traffic Report', from the store dashboard go to:
> Reports > Traffic Report

From within this page you can track, measure and analyze a great range of data, the first being the 'Overview Report':
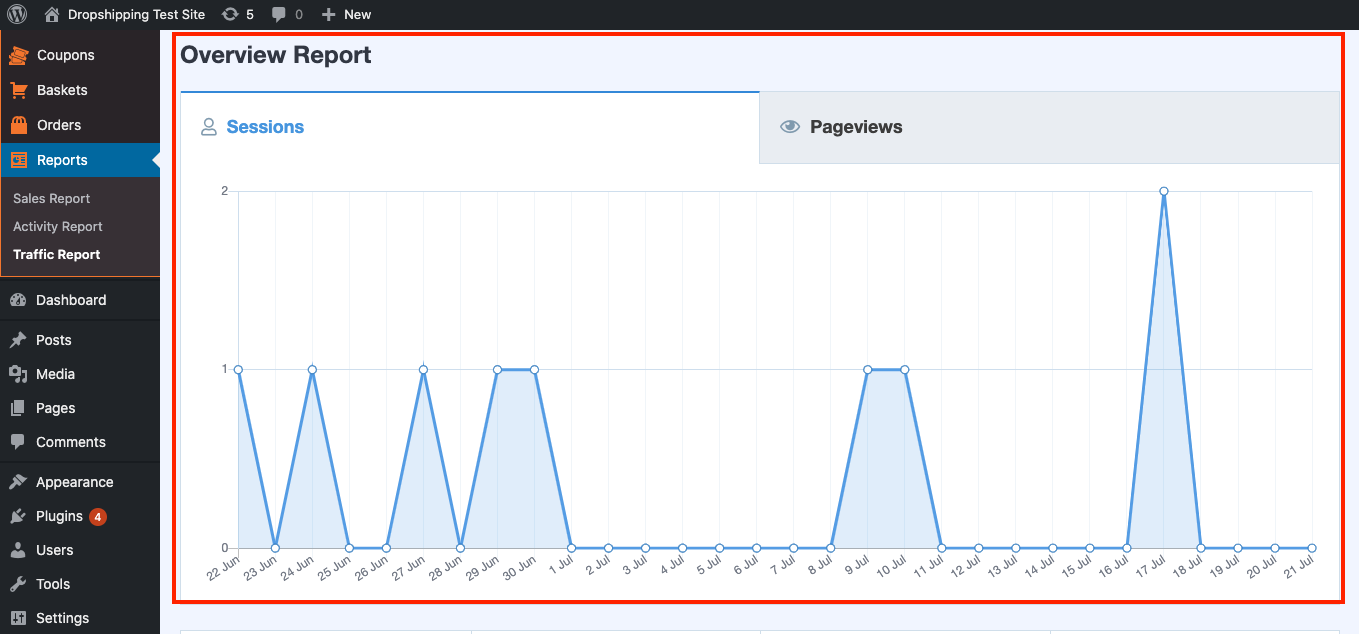
In this graph you can see 30 days worth of total 'Sessions' (a single 'Session' can include many 'Pageviews', if a User navigates to any other web pages on your website without leaving):

And 30 days worth of total 'Pageviews' (represents each individual time a page on your website is loaded by a User):

Hover over the graph with your cursor to take a closer look:

Underneath the graph you'll find an overall look at the 'Sessions' and 'Pageviews' including two other metrics, 'Average Session Duration' and 'Bounce Rate':
*Hovering over the 'i' symbol (located above these terms) will give you their definitions*

Below those metrics are more data including 'New vs. Returning Visitors' and 'Device Breakdown':

'Top 10 Countries' and 'Device Breakdown' comes next and clicking 'View Countries Report' or 'View All Referral Sources' will send you to your Google Analytics account to analyze these statistics in more detail:

'Top Posts/Pages' is the last metric on the 'Traffic Report' and clicking 'View Full Posts/Pages Report' will also send you to your Google Analytics for a more in-depth look:

Related Articles
Activity Report (Full Guide)
Activity Report (Full Guide) To see your 'Activity Report', from the store dashboard go to: > Reports > Activity Report From within this page you can see all the changes you've made since the beginning.Sales Report (Full Guide)
Sales Report (Full Guide) To see your 'Sales Report', from the store dashboard go to: > Reports > Sales Report From within this page you can track and analyse the key indicators of your business. The 'Overview' provides a summary of your total orders ...Baskets (Full Guide)
Baskets (Full Guide) To see your 'Add to Baskets', from the store dashboard go to: > Baskets From within this page you can see all the customers who added to basket but didn't checkout. With this information you can retarget those customers so that ...Orders (Full Guide)
Orders (Full Guide) To see your 'Orders', from the store dashboard go to: > Orders From within this page you can see all the customers who placed an 'Order' with you and their status will be pooled at the top in various categories for quick and easy ...Editing Products (Full Guide)
Editing Products (Full Guide) To access the 'Product Details', from the store dashboard go to: > Products > All Products From within this page find the 'Product' you'd like to 'Edit' by either scrolling through or searching for it via the search box ...